
Active and passive coefficients of lateral earth pressures
- Jan 25, 2024
- 1 min read
Updated: Mar 21, 2024
Active and Passive Coefficients of Lateral Earth Pressures
DeepEX offers a number of options for evaluating the Active and Passive coefficients that depend on the analysis method employed (Nonlinear or Conventional). THe following sections present the methods employed in determining active and passive coefficients/pressures in Conventional and Nonlinear analyses respectively. However, in all cases the methods listed in Table 1 are available for computing active and passive coefficients.
Table 1: Available Exact Solutions for Active and Passive Lateral Earth Pressure Coefficients
Method | Active Coefficient | Passive Coefficient | |||||||
Available | Surface angle | Wall Friction | EQ2 | Available | Surface angle | Wall Friction | EQ | ||
NO | Rankine | YES | NO1 | NO1 | NO | YES | NO1 | NO1 | NO |
YES | Coulomb | YES | YES | YES | NO | YES | YES | YES | YES |
NO | Caquot-Kerisel Tabulated | NO | - | - | - | YES | YES | YES | NO |
YES | Lancellota | NO | - | - | - | YES | YES | YES | YES |
Notes:
Rankine method automatically converts to Coulomb if a surface angle or wall friction is included.
Seismic effects are added as separately.
Active and Passive Pressures in the Conventional Analyses
In the conventional analysis the software first determines which side is generating driving earth pressures. Once the driving side is determined, the software examines if a single ground surface angle is assumed on the driving and on the resisting sides. If a single surface angle is used then the exact theoretical equation is employed as outlined in. If an irregular ground surface angle is detected then the program starts performing a wedge analysis on the appropriate side. Horizontal ground earth pressures are then prorated to account for all applicable effects including wall friction. It should be noted that the active/passive wedge analyses can take into account flownet water pressures if a flownet is calculated.
The computed active and passive earth pressures are then modified if the user assumes another type of lateral earth pressure distribution (i.e. apparent earth pressure diagram computed from active earth pressures above subgrade, divide passive earth pressures by a safety factor, etc.).
All of the above Ka/Kp computations are performed automatically for each stage. The user has only to select the appropriate wall friction behavior and earth pressure distribution.
Active and Passive Pressures for Non-Level Ground
Occasionally non-level ground surfaces and benches have to be constructed. The current version of DeepEX can handle both single angle sloped surfaces (i.e single 10degree slope angle) and complex benches with multiple points. DeepEX automatically detects which condition applies. For single angle slopes, DeepEX will determine use the theoretical Rankine, Coulomb, or Caquot-Kerisel active, or passive lateral thrust coefficients (depending on user preference).
For non level ground that does not meet the single slope criteria, DeepEX combines the solutions from a level ground with a wedge analysis approach. Pressures are generated in a two step approach: a) first, soil pressures are generated pretending that the surface is level, and then b) soil pressures are multiplied by the ratio of the total horizontal force calculated with the wedge method divided by the total horizontal force generated for a level ground solution. This is done incrementally at all nodes throughout the wall depth summing forces from the top of the wall. Wall friction is ignored in the wedge solution but pressures with wall friction according to Coulomb for level ground are prorated as discussed.
This approach does not exactly match theoretical wedge solutions. However, it is employed because it is very easy with the iterative wedge search (as shown in the figure below) to miss the most critical wedge. Thus, when lateral active or passive pressures have to be backfigured from the total lateral force change a spike in lateral pressure can easily occur (while the total force is still the same). Hence, by prorating the active-passive pressure solution a much smoother pressure envelope is generated. In most cases this soil pressure envelope is very close to the actual critical wedge solution. The wedge methods employed are illustrated in the following figures.
Surcharge loads are not considered in the wedge analyses since surcharge pressures are derived separately using well accepted linear elasticity equations.
In the 2015 version, the usIn DeepEX, user has the option of either performing a Wedge search, or performing an automatic search using the automatic failure search options. The automatic search options might produce lateral pressures that have slight abrupt changes as computed pressures are sensitive on the total computed forces. When compared to the wedge methods, the automatic search option may give slightly less conservative results when the critical failure surface is predominantly in a wedge type format. On the other hand, the automatic search option might be ideal when the general failure mass extends far beyond the typical active wedge, as is the case when clays are present when global stability is an issue.

Figure 1.a: Active force wedge search solution according to Coulomb.

Figure 1.b: Passive force wedge search solution according to Coulomb.

Figure 2: Illustration of automatic search methods for active and passive thrusts.
Peck 1969 Earth Pressure Envelopes
After observation of several braced cuts Peck (1969) suggested using apparent pressure envelopes with the following guidelines:

γ is taken as the effective unit weight while water pressures are added separately (private communication with Dr. Peck).
Figure: Apparent Earth Pressures as Outlined by Peck, 1969
For mixed soil profiles (with multiple soil layers) DeepEX computes the soil pressure as if each layer acted only by itself. After private communication with Dr. Peck, the unit weight g represents either the total weight (for soil above the water table) or the effective weight below the water table. For soils with both frictional and undrained behavior, DeepEX averages the "Sand" and "Soft clay" or "Stiff Clay" solutions. Note that the Ka used in DeepEX is only for flat ground solutions. The same effect for different Ka (such as for sloped surfaces), can be replicated by creating a custom trapezoidal redistribution of active soil pressures.
FHWA Apparent Earth Pressures
The current version of DeepEX also includes apparent earth pressure with FHWA standards (Federal Highway Administration). The following few pages are reproduced from applicable FHWA standards.

Figure 1: Recommended apparent earth pressure diagram for sands according to FHWA

Figure 2: Recommended apparent earth pressure diagram for stiff to hard clays according to FHWA.
In both cases for figures 2.4 and 2.5, the maximum pressure can be calculated from the total force as:
For walls with one support: p= 2 x Load / (H +H/3)
For walls with more than one support: p= 2 x Load /{2 H – 2(H1 + Hn+1)/3)}
FHWA Recommended Apparent Earth Pressure Diagram for Soft to Medium Clays
Temporary and permanent anchored walls may be constructed in soft to medium clays (i.e. Ns>4) if a competent layer of forming the anchor bond zone is within reasonable depth below the excavation. Permanently anchored walls are seldom used where soft clay extends significantly below the excavation base.
For soft to medium clays and for deep excavations (and undrained conditions), the Terzaghi-Peck diagram has been used to evaluate apparent earth pressures for design of temporary walls in soft to medium clays. For this diagram apparent soil pressures are computed with a “coefficient”:

Where m is an empirical factor that accounts for potential base instability effects in deep excavations is soft clays. When the excavation is underlain by deep soft clay and Ns exceeds 6, m is set to 0.4. Otherwise, m is taken as 1.0 (Peck, 1969). Using the Terzaghi and Peck diagram with m=0.4 in cases where Ns>6 may result in an underestimation of loads on the wall and is therefore not conservative. In this case, the software uses Henkel’s equation as outlined in the following section.
An important realization is that when Ns>6 then the excavation base essentially undergoes basal failure as the basal stability safety factor is smaller than 1.0. In this case, significant soil movements should be expected below the excavation that are not captured by conventional limit equilibrium analyses and may not be included in the beam-on-elastoplastic simulation (Nonlinear).
The software in the case of a single soil layer will use this equation if Ns>4 and Ns<=6.
FHWA Loading for Stratified Soil Profiles
The apparent earth pressure diagrams described above were developed for reasonably homogeneous soil profiles and may therefore be difficult to adapt for use in designing walls in stratified soil deposits. A method based on redistributing calculated active earth pressures may be used for stratified soil profiles. This method should not be used for soil profiles in which the critical potential failure surface extends below the base of the excavation or where surcharge loading is irregular. This method is summarized as follows:
Evaluate the active earth pressure acting over the excavation height and evaluate the total load imposed by these active earth pressures using conventional analysis methods for evaluating the active earth pressure diagram assuming full mobilization of soil shear strength. For an irregular ground surface the software will perform a trial wedge stability analysis to evaluate the total active thrust.
The total calculated load is increased by a factor, typically taken as 1.3. A larger value may be used where strict deformation control is desired.
Distribute the factored total force into an apparent pressure diagram using the trapezoidal distribution.
Where potential failure surfaces are deep-seated, limit equilibrium methods using slope stability may be used to calculate earth pressure loadings.
The Terzaghi and Peck (1967) diagrams did not account for the development of soil failure below the bottom of the excavation. Observations and finite element studies have demonstrated that soil failure below the excavation bottom can lead to very large movements for temporary retaining walls in soft clays. For Ns>6, relative large areas of retained soil near the excavation base are expected to yield significantly as the excavation progresses resulting in large movements below the excavation, increased loads on the exposed portion of the wall, and potential instability of the excavation base. In this case, Henkel (1971) developed an equation to directly obtain KA for obtaining the maximum pressure ordinate for soft to medium clays apparent earth pressure diagrams (this equation is applied when FHWA diagrams are used and the program examines if Ns>6):

Where m=1 according to Henkel (1971). The total load is then taken as:

Figure: Henkel’s mechanism of base failure
The Figure below shows values of KA calculated using Henkel’s method for various d/H ratios. For results in this figure Su = Sub. This figure indicates that for 4<Ns<6, the Terzaghi and Peck envelope with m=0.4 is overly conservative relative to Henkel. Also, for Ns<5.14 the Henkel equation is not valid and apparent earth pressures calculated using m=1.0 in the Terzaghi and Peck envelope are unrealistically low. For the range 4<Ns<5.14, a constant value of Ka=0.22 should be used to evaluate the maximum pressure ordinate for the soft to medium clay apparent earth pressure envelope. At the transition between stiff-hard clays to soft-medium clays, i.e. Ns= 4, the total load using the soft to medium apparent earth pressure diagram with Ka= 0.22 is 0.193 H2 resulting in a maximum pressure p=0.26 H. Use of Ka= 0.22, according to FHWA, represent a rational transition value for these cases.
Henkel’s method is limited to cases where the clays soils on the retained side of the excavation and below the excavation can each be reasonably characterized using a constant value for undrained shear strength. Where a more detailed shear strength profile is required, limit equilibrium methods may be used to evaluate the earth pressure loadings on the wall described in section 5.7.3 of the FHWA manual (not performed within the software).

Figure: Comparison of apparent lateral earth pressure coefficients with basal stability index (FHWA 2004).
For clays the stability number is defined as:

Please note that software uses the effective vertical stress at subgrade to find an equivalent soil unit weight, Water pressures are added separately depending on water condition assumptions. This is slightly different from the approach recommended by FHWA, however, after personal communication with the late Dr. Peck, has confirmed that users of apparent earth pressures should use the effective stress at subgrade and add water pressures separately.
By ignoring the water table, or by using custom water pressures, the exact same numerical solution as with the original FHWA method can be obtained.
Modifications to stiff clay and FHWA diagrams
Over the years various researchers and engineers have proposed numerous apparent lateral earth pressure diagrams for braced excavations. Unfortunately, most lateral apparent pressure diagrams have been taken out of context or misused. Historically, apparent lateral earth pressure diagrams have been developed from measured brace reactions. However, apparent earth pressure diagrams are often arbitrarily used to also calculate bending moments in the wall.
In excavations supporting stiff clays, many researchers have observed that the lower braces carried smaller loads. This has misled engineers to extrapolate the apparent lateral earth pressure to zero at subgrade. In this respect, many apparent lateral earth pressure diagrams carry within them a historical unconservative oversight in the fact that the lateral earth pressure at subgrade was never directly or indirectly measured. Konstantakos (2015) has proven that the zero apparent lateral earth pressure at the subgrade level assumption may be unconservative. This historical oversight, can lead to severe underestimation of the required wall embedment length and of the experienced wall bending moments.
If larger displacements can be tolerated or drained conditions are experienced the apparent earth pressure diagrams must not, at a minimum, drop below the theoretical active pressure, unless soil arching is carefully evaluated. Alternatively, in these cases, for fast calculations or estimates, an engineer can increase the apparent earth pressure from 50% at midway between the lowest support level and the subgrade to the full theoretical apparent pressure or the active pressure limit at the subgrade level. As always, these equations represent a simplification of complex conditions.
If tighter deformation control is required or when fully undrained conditions are to be expected, then the virtual reaction at the subgrade level has to take into account increased lateral earth pressures that can even reach close to fifty percent of the total vertical stress at the subgrade level. The initial state of stress has to be taken into consideration as overconsolidated soil strata will tend to induce larger lateral earth stresses on the retaining walls. In such critical cases, a design engineer must always compliment apparent earth pressure diagram calculations with more advanced and well substantiated analysis methods.
The above modifications can be applied within the software by double clicking on the driving earth pressure button when the FHWA or Peck method is selected.
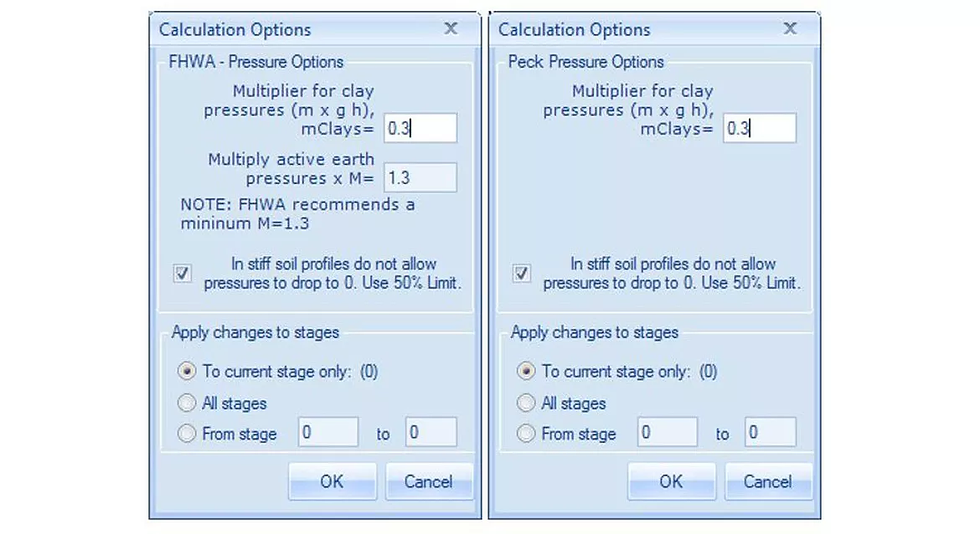
Figure: Minimum lateral pressure option for FHWA and Peck apparent pressure diagrams (check box).

Figure: Proposed modifications to stiff clay and FHWA apparent lateral earth pressure diagrams (Konstantakos 2010).
Custom Trapezoidal Pressure Diagrams
With this option the apparent earth pressure diagram is determined as the product of the active soil thrust times a user defined factor. The factor should range typically from 1.1 to 1.4 depending on the user preferences and the presence of a permanent structure. The resulting horizontal thrust is then redistributed as a trapezoidal pressure diagram where the top and bottom triangular pressure heights are defined as a percentage of the excavation height.

Figure: Custom Trapezoidal Pressures diagram in DeepEX
Two Step Rectangular Pressure Diagrams
Very often, especially in the US, engineers are provided with rectangular apparent lateral earth pressures that are defined with the product of a factor times the excavation height. Two factors are usually defined M1 for pressures above the water table and M2 for pressures below the water table. M1 and M2 should already incorporate the soil total and effective weight. Use of this option should be carried with extreme caution. The following dialog will appear if the rectangular pressure option is selected in the driving pressures button.

Figure: Two step rectangular earth pressure coefficients.
Vertical wall adhesion in undrained loading
Short term total stress conditions (i.e. undrained loading) represent the state in the soil before the pore water pressures have had time to dissipate i.e. immediately after construction in a cohesive soil. For total stress the horizontal active and passive pressures are calculated using the following equations:
pa = Ka ( γ z+q) – Su Kac
pp = Kp( γ z+q) + Su Kpc
Where:
(γ z+q) represents the total overburden pressure
Ka = Kp = 1.0 for cohesive soils.
Design su= sud= sumc/ FSsu where Fssu is typically 1.5. The earth pressure coefficients, Kac and Kpc, make an allowance for wall /soil adhesion and are derived as follows:
Kac= Kpc= 2√(1+Swmax /Sud)0.5
According to the Piling Handbook by Arcelor (2005), the limiting value of wall adhesion Swmax at the soil/sheet pile interface is generally taken to be smaller than the design undrained shear strength of the soil, sud, by a factor of 2 for stiff clays. i.e. Sw max = α x Sud, where α = 0.5. Lower values of wall adhesion, however, may be realized in soft clays. In any case, the designer should refer to the design code they are working to for advice on the maximum value of wall adhesion they may use. Currently, these modifications can be used only in conventional limit equilibrium analyses.

WMATA Construction Manual Pressures
The WMATA adjacent construction manual (2015), specifies how deep excavations adjacent to WMATA structures should be designed and constructed. When it comes to deep excavations WMATA guidelines have similarities to and differences vs. other accepted guidelines. DeepEX incorporates WMATA guidelines and standards as an independent analysis method.
For multiple supports WMATA utilizes an apparent earth pressure diagram with ordinates at 0.2H from the top and the bottom of the excavation. The maximum apparent pressure is calculated by applying a stiffness factor on the calculated active earth pressures that is either 1.25 or 1.5 depenending on the adopted wall system. Minimum apparent pressures are either set at 25H or 29H depending on the wall type. The wall beam is analyzed with a continuous beam that is pinned at the excavation subgrade.
Soldier pile with rakers design with WMATA adjacent construction manual methods in DeepEX
Figure 1: Soldier pile excavation supported by two levels of rakers, showing apparent earth pressures and bending moments with WMATA methods from DeepEX software
For cantilever walls or walls supported by one level of bracing WMATA recommends using a stiffness factor of 1.25 on active earth pressures. In all cases, a factor of 1.5 is used to reduce passive resisting earth pressures within the excavation.
Soldier pile wall with tiebacks analyzed with WMATA adjacent construction manual methods with DeepEX
Figure 2. Soldier pile excavation supported by two levels of tiebacks, showing apparent earth pressures and bending moments with WMATA methods from DeepEX software
With external surcharges WMATA utilizes specific approach for calculating their impact on an excavation. Generally only surcharges that fall within the WMATA influence zone are considered (set at 45 degrees two feet below the subgrade). These recommendations are taken into account by DeepEX automatically once WMATA methods for surcharges are selected.
External surcharges on a deep excavation with WMATA approach in DeepEX software
Training Video: Lateral Earth Coefficients and Soil Pressure Methods in DeepEX


Wish to Learn about all Implemented Methods?
Book a FREE online presentation now!

DeepEX - Shoring Design Software
DeepEX is the ultimate software program for design and analysis of Deep Excavations! Design any wall type and support system in the most efficient way!
|
|
|
|
|
|

DeepEX Features
All software features and capabilities! Review all available design methods and analysis standards!

DeepEX Upgrades
We continue our research and we introduce new unique features that extend the software capabilities!

Training
Get professional training on DeepEX through videos, examples, webinars and online software presentations!

DeepEx Demo
Structural and Geotechnical design of Deep Excavations.
Try the Full version for free and see how you can design and optimize any deep excavation model in the most efficient way!
Starting at
$ 3750

Web Presentation
Get a Free online presentation! Learn about all software features and capabilities!

Purchase DeepEX
Get the most powerful shoring design software! Customize your version!

Software
Review our software programs for geotechnical engineers and contractors!


